AI debugging: from plausible patches to reproducible evidence

Yingchen Liu
How I evolved AI-assisted debugging from code inspection and likely fixes into a reproducible workflow: exact bug data, real product paths, layered observability, regression tests, computer-use verification and physical-device evidence where the boundary requires it.
- AI debugging
- Real-device testing
- Evidence architecture
01
What AI-assisted debugging means in practice
AI-assisted debugging is not asking a model to read an error and guess a patch. It is using an agent to accelerate a controlled investigation: preserve the reported case, reproduce it through the real product, observe the failing layer, fix the root cause and rerun the same case with evidence appropriate to that boundary.
I developed this workflow across Mapify, Henri and AxIT. Mapify established disciplined source, database and migration investigation. Henri added bug categorisation, captured device and backend logs, screenshots, isolated test stacks, database verification and audit skills. AxIT made the evidence contract explicit across browser, simulator, physical device, Bluetooth hardware, shared calculations and human release acceptance.
The aim is not to make every bug slow. It is to spend effort where uncertainty lives. A pure function may need a focused unit test. A layout regression needs the same screen, data and viewport before and after. A Bluetooth lifecycle bug needs the real app and hardware. The agent should know which claim each kind of evidence can—and cannot—support.
02
The problem
AI is extremely good at producing a coherent explanation for incomplete evidence. Give it a screenshot and a repository and it can often find a relevant view, identify a suspicious conditional and propose a patch within minutes. The danger is that coherence feels like causality. The visible screen may be downstream of stale state, an API contract, a database migration, a feature flag, a device capability or a race that never appears in the file the screenshot resembles.
A green build creates a second trap. Compilation proves that the code can be assembled. A unit test proves the behaviour represented by that test. Neither proves that the app launches, that the user can reach the screen, that the backend returns the expected record, that the layout works on another device class or that Bluetooth reconnects after the app returns from the background.
The debugging process therefore needed its own architecture. It had to make the agent collect ground truth before editing, choose observations by failure type, preserve the original case, and distinguish automated, simulated, physical-device and human acceptance evidence instead of compressing them into one word: tested.
03
From a likely fix to a reproducible debugging loop
Architecture
The earlier loop optimised for reaching a patch. The evolved loop preserves the exact case and makes each verification claim traceable to the evidence that supports it.
Before
Why could a plausible patch still be wrong?
The agent could move quickly while missing the product state, failing layer or environment that produced the symptom.
- 01
Read the description
Start from a screenshot, error message or short report without preserving its exact data and state.
- 02
Inspect likely code
Search for the visible text or stack and form a hypothesis from the first plausible owner.
- 03
Patch and run tests
A build or nearby test passes, but the original product path may never have been exercised.
After
What makes the fix reproducible?
The investigation protects the failing case, tests the hypothesis at the right layer and closes the loop through the same product path.
- 01
Capture the exact case
Save ticket or replay evidence, values, route, state, build, environment and before behaviour.
- 02
Observe before guessing
Use the relevant logs, hierarchy, request, database row, trace or device state to locate the owner.
- 03
Fix the root and regress it
Change the smallest complete boundary and add automation that fails for the original cause.
- 04
Rerun the same real path
Use the same data, screen and viewport, then capture the evidence level the claim requires.
The early approach: useful evidence, a loose loop
On Mapify, the strongest early debugging tools were close to the system: inspect the PostgreSQL schema, query records, count migration states, read migration errors, check missing search vectors and compare backend logs with the code that wrote the data. That was already much better than editing from a symptom alone. Read operations were safe by default; any database write required a preview of affected records and explicit approval.
The limitation was not the quality of those checks. It was that the loop was still mostly task-specific. A database investigation could be excellent without a reusable contract for the exact browser state, account, input file, feature flag and visible before/after behaviour. The next debugging session depended on remembering which evidence had mattered last time.
That experience shaped the later system: keep the direct access to source, logs and data, but wrap it in a workflow that can be repeated by another agent and audited by another engineer.
Henri: categorise before hypothesising
Henri's debugging skill begins by classifying the failure. A UI or layout problem starts with a device screenshot and view hierarchy. A data or state problem starts with captured logs, state and read-only database queries. An API problem adds network and backend logs. A crash starts with the stack trace. The category does not solve the bug; it selects the observations that can disprove the first theory.
The workflow reuses captured artefacts before asking for another reproduction: iOS logs, backend logs, the current device screenshot and saved test results. If that evidence is insufficient, the agent instruments the suspected boundary and runs the case again. It is explicitly told not to guess. For visual ambiguity, temporary coloured borders can reveal which container owns unexpected spacing; for data ambiguity, a read-only query can show whether the wrong value was stored or merely rendered incorrectly.
The fix also has to respect the surrounding system. A layout correction checks the shared component and design tokens before patching one screen. A schema or persisted-contract regression audits older onboarding, resume, library, dashboard and reset paths that read the same state. After implementation, the agent self-reviews for duplicated components, inconsistent neighbouring states and new constants that belong in the shared design system.
Build an observation stack, not one giant log
Different evidence answers different questions. The visible screenshot says what the person saw. The view hierarchy says which element owned the geometry. Runtime logs show ordering and state transitions. A network trace separates a client timeout from a server error. A backend log follows the request beyond the mobile boundary. A database read shows what persisted. A crash stack locates the failing path. An Instruments trace aligns hangs, hitches, CPU work, signposts and application logs on one timeline.
The agent's job is to connect those signals without treating them as interchangeable. If the database row is correct but the screen is wrong, changing the write path is noise. If a request fails before reaching the server, backend retry logic is not the first owner. If an Instruments trace shows the stall before a named log event, the investigation can focus on the preceding work rather than broadly ‘optimising SwiftUI’.
This layered approach also produces better handovers. The root-cause explanation can point from observed symptom to state transition, request, record or hot path. Another engineer can challenge that chain instead of reviewing a patch whose only justification is that it appeared to work once.
Preserve the exact bug before touching the code
For reported bugs, I now create a reproduction data contract before implementation: where the evidence came from, the exact visible values, any values inferred from them, the route and selected tab, the app build and backend, feature flags, locale, device or viewport, and how the evidence was captured.
Original attachments or replay data are preferable to screenshots of a ticket page. Concrete values in a report should become the fixture or controlled test data; easier placeholder numbers can hide the calculation, formatting or threshold that caused the problem. If the report implies a value rather than stating it, the inference is recorded instead of silently becoming fact.
This contract is what makes before and after meaningful. The pair is only comparable when it uses the same data, real screen, relevant state and viewport. If that exact rerun is impossible, the report says so and keeps the original ticket evidence separate instead of presenting mismatched pictures as proof.
Use computer use to exercise the product, not fabricate proof
Computer use is valuable because the agent can operate the product as a person would: open the app or browser, navigate through the normal route, select the reported state, reproduce the interaction, inspect the visible result and repeat the path after the fix. It turns visual verification from ‘please check this manually later’ into part of the engineering loop.
The boundary is important. A desktop screenshot of a Simulator window includes computer chrome and may hide or scale device pixels. A generated SwiftUI capture screen, preview wrapper, Storybook page or reconstructed HTML can resemble the product while bypassing navigation, state, native payload construction or backend behaviour. Those views are useful diagnostics; they are not authoritative evidence that the product path works.
For final mobile evidence, the workflow captures the complete simulator or emulator framebuffer directly—`simctl` on iOS or the Android equivalent—then checks orientation and readability. Computer use drives the journey and inspects the result; the device capture records what the mobile runtime actually rendered. For browser products, the real browser route and loaded state remain the authoritative surface.
Test in layers—and stop at the first hard failure
Henri's full test workflow makes the order explicit. First comes a compile gate. Launch-sensitive changes then require a launch smoke test because an app can compile and still crash while creating its first model or predicate. Unit tests run next because they are fast and isolate logic. Targeted UI tests verify the changed journey fresh. Full UI coverage can then run in isolated parallel shards, followed by a single-stack database verification pass when aggregate persisted state matters.
Each UI-test stack owns its backend, PostgreSQL database, Redis, object storage, simulator and build output. Isolation matters because a green parallel run is meaningless if shards silently share a backend URL or skip database-backed cases. The runner checks enumerated tests against executed tests and cleans leaked containers and simulators after interrupted runs.
A failure is classified before anything is edited. A deterministic failure that repeats in isolation may be a product defect or stale expectation. A failure that passes on retry may expose shared state or ordering. A multi-minute test may indicate an overloaded simulator or hung backend; its results are not trusted. A backend that never started is an environment failure, not evidence that the application regressed. The aim is to repair the right system, not simply return the dashboard to green.
Simulators create repeatability; real devices prove the boundary
AxIT uses a managed simulator matrix rather than whichever device happens to be open: a small phone, a large phone and a representative iPad, with additional tablet coverage when the layout or resizable window requires it. The real app is installed, the affected screen is reached through normal navigation, and complete before/after framebuffers are inspected for clipping, safe areas, keyboard behaviour, Dynamic Type and readable hierarchy.
That matrix is intentionally the default even when physical devices are nearby. Simulators are reproducible, resettable and suitable for parallel automated coverage. They do not prove Bluetooth discovery, connection ownership, sensor sampling, physical-device performance or an install on the target hardware.
When the boundary is hardware-only, the claim stays pending until the exact signed build is installed and exercised on a paired device. The physical-device workflow records the model, bundle, marketing version and build, source revision, dirty state, installation path and launch result. Performance profiling also respects the boundary: some SwiftUI Instruments data is available only from a real device, while Simulator runs use the profiler lanes they can actually populate.
Close the loop with the same case
After the root-cause change and regression test, the agent reruns the original steps through the same real product path. It uses the saved data or fixture, account, environment, feature flags, selected state and viewport whenever possible. A multi-state bug repeats the same state matrix; a multi-step workflow captures every meaningful stage and the final persisted result.
The resulting record separates what is visible from what proves the transition. A screenshot can show the corrected loaded state. A test or log can prove an invisible lifecycle event. A physical-device observation can prove Bluetooth behaviour. A human test result can approve the build. Keeping those claims separate makes the report more useful, not less confident.
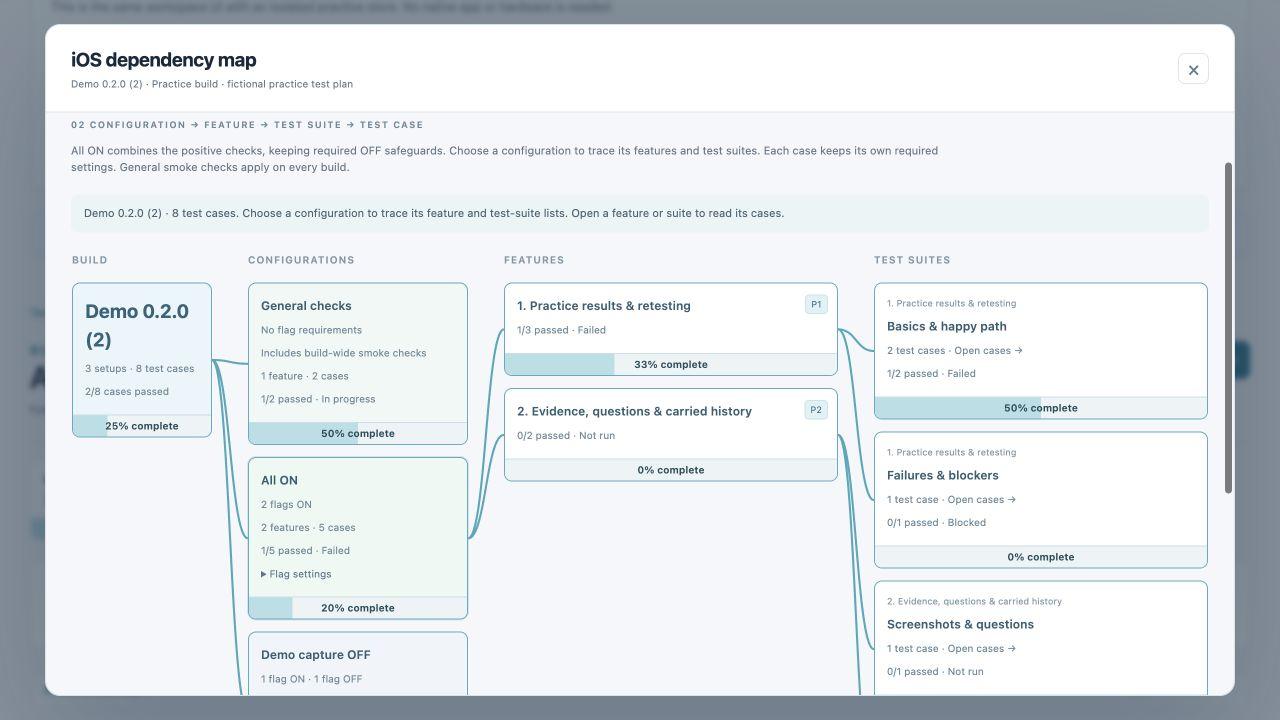
On AxIT, SBN Testing extends that loop across the team. Exact-build plans, dependency maps, shared evidence, live progress and questions let testers contribute in small windows while developers respond to failures before the whole pass ends. Existing results and private evidence are preserved when a plan changes; a new automated run never rewrites a person's acceptance history.
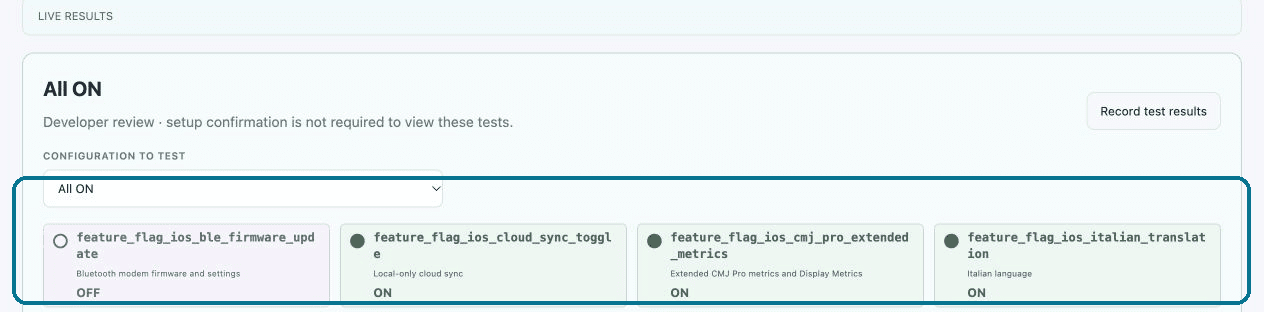
Shared verification record
Exact-build progress and evidence stay visible while testing continues. This coordinates the team; it does not replace simulator, physical-device, domain-expert or release evidence.
04
The decision
I turned debugging into a repository-owned workflow rather than a conversational habit. Skills define intake, reproduction, observation, implementation, regression, same-path verification and cleanup. Feature specifications preserve corrected behaviour. Investigation and release records preserve the case, evidence and remaining risk. Shared test plans preserve human results instead of overwriting them on the next build.
The workflow uses an evidence ladder. Source inspection and tests can prove code contracts. Real-app simulator or emulator runs can prove reachable UI and controlled lifecycle behaviour. Physical devices can prove hardware boundaries. Domain experts approve scientific or business meaning. Testers and release owners accept the exact build. The agent reports the highest rung actually reached; it never promotes one rung into the next.
The decisions that shaped the system
- 01
Write the reproduction contract before the fix
Record the source data, visible values, inferred values, route, selected state, build, environment, device or viewport and capture method. The after check must be able to rerun that contract instead of inventing a friendlier case.
- 02
Observe the layer that owns the symptom
Use screenshots and hierarchy for layout, logs and state for lifecycle, network and backend logs for API behaviour, database reads for persistence, stack traces for crashes and Instruments traces for performance. Source inspection alone is not runtime evidence.
- 03
Exercise the product; do not recreate the screenshot
Computer use navigates and inspects the real browser or app flow. A preview, generated page or screenshot-only view may explain a hypothesis, but it cannot prove that the shipped workflow works.
- 04
Keep the device boundary honest
Simulator and emulator matrices provide repeatable UI and lifecycle coverage. Physical devices prove device-only behaviour such as Bluetooth, real performance or installation. One must never be reported as the other.
- 05
Classify a failing test before changing it
A deterministic product failure, stale assertion, flaky shared state, overloaded simulator and unavailable backend need different responses. Patching the assertion before classification can turn a useful alarm into a false green build.
05
What improved
The largest improvement is not that the agent finds every bug immediately. It is that a wrong hypothesis becomes cheaper to reject. The case is preserved, the next observation is deliberate and the fix is measured against the original symptom rather than a convenient nearby test.
The workflow reduces repeated explanation across sessions. A new agent can read the reproduction contract, owning specification, investigation, test result and remaining boundary. Parallel work becomes safer because each participant knows which artefacts it owns and which claims remain unverified.
It also improves communication with non-engineers. A product owner can review corrected behaviour, a domain expert can focus on changed results, a tester can follow the exact build and a release owner can see what still requires hardware or human acceptance. Technical evidence becomes a coordination tool instead of an opaque collection of logs.
06
What I learned
AI is strongest at breadth: searching multiple repositories, correlating logs and code, generating hypotheses, adding instrumentation and building a regression quickly. It is weakest where the ground truth is implicit. The workflow must force state, environment and evidence into the open before confidence rises.
The most important debugging artefact is often not the patch. It is the reproducible case. A preserved case can reject regressions, compare platforms, expose a future architectural change and teach the next agent why the original solution exists.
No single test surface is ‘real enough’ for every question. A database query, unit test, browser flow, simulator screenshot, physical-device run and human approval are complementary instruments. Mature debugging means choosing the cheapest instrument that can prove the claim—and explicitly stopping when the next boundary has not been crossed.
Finally, good AI debugging is a team design problem. The agent becomes much more useful when the repository teaches it how to observe, when to ask, what not to destroy, how to preserve evidence and where human judgement enters the loop.
Takeaways
- Preserve the exact failing case before editing implementation code.
- Choose screenshots, logs, requests, database reads and traces by failure type.
- Use computer use to drive the real workflow; capture final mobile evidence from the device framebuffer.
- Run targeted automation first, then broader isolated coverage and persistence checks.
- Treat Simulator and physical-device evidence as different acceptance levels.
- Rerun the same data, screen, state and viewport after the fix.
- Report the highest evidence level reached—and leave the next boundary pending.